Owing to its huge dependence on
crude oil, India’s macro-economic factors are majorly depend upon crude prices.
Indian rupee is no exception in this regard, so when global crude prices slump
in second half of 2014, Rupee entered into a great period of low volatility.
Indian rupee joined the top 5 performing EM currencies from fragile five in
2013.
Surge in Volatility: A Reality!
Weekly Realized
Volatility of USDINR
As above chart shows weekly realized
volatility of USDINR pair. For calculating realized volatility weekly return on
closing basis considered and standard deviation from 12 week moving average is
considered. A closer look to above chart, shows rupee had been in a period of
low volatility from Jan-14 to Aug-18. During this period volatility remained kept
1% level and at times fell to 0.4% also.
Weekly Range of
USDINR
To compare volatility
in recent past, Weekly range, difference of high and low, of USDINR pair is
compared. During FY-15 to FY18 there has been 5 instances of more than 2% weekly
range, same as in FY-19. The below chart shows, % of weeks with more than 1%
weekly range. While FY-15, FY-16 witnessed 45% weeks with more than 1% weekly
range and FY-17, FY-18 witnessed 25% weeks with more than 1% weekly range. But
FY-19 is a clear outlier as nearly 75% of weeks witnessed more than 1% weekly
range.

This long period of low volatility
can also be attributed to RBI’s management during this period. Dr. Raghuram
Rajan believed India need to have a ‘Bullet Proof’ balance to manage global turmoil’,
hence RBI’s forex reserve grew substantially from USD 277.1 Bn in September
2013 to USD 400 Bn August 2018. RBI regularly intervened in FX markets to
absorb foreign inflows, keeping large gains in Rupee at bay. Though, RBI was
net buyer during the period, but it was actively intervening both sides keeping
volatility artificially low. It is note-worthy that RBI was cautious about
imported inflation thus kept sudden depreciation of rupee under check.
Due to relatively stable USD/INR
move and high forward premiums have induced a passive hedging in market participants.
While receiving premiums, exporter tends to hedge long-term in expectation of
stable rupee and Importers tends to delay long-term hedge as they have to pay
high forward premium. For importers the decision to hedge or not depend a lot
on its residual maturity.
USDINR Forward Premium: Steady Decline a game changer!
As shown in the figure below, 1
Year forward premium in USD/INR has seen steady declined owing to change in
interest rates in both economies, India and US. 1 Year annualized forward
premium declined from 6.50% in October-15 to 4.00% in Dec-2018. Going forward,
USDINR forward premium might decline further amid expectation of interest cut
in India in the next fiscal.
Fig: 1 Year Annualized
Forward Premium of USDINR
The decline in forward premium
and a surge in volatility in USD/INR should ideally nudge market participant towards
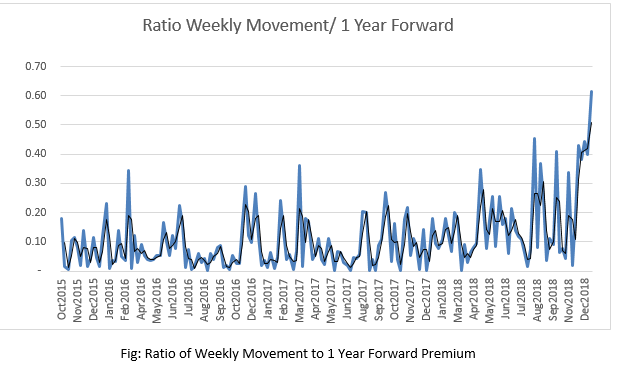
more active hedging policies. To ascertain the point the further, ratio of Weekly
movement and 1 year forward premium is analyzed.
Ratio: Mod(% Weekly movement)/ 1
Year annualized premium
The modulus of weekly movement is
taken to keep ratio positive, so this ratio only compare weekly movement vs 1
year forward premium.
Fig: Ratio of Weekly
Movement to 1 Year Forward Premium
As
above chart suggest, Up-until end FY-18 ratio
remained relatively low b/w 0.05-0.2, which means every week movement is just
20% of 1 year forward premium. But due to recent increase in volatatlity and
declining forward premium, the ratio has seen a significant jump. The ratio has
even spiked to above 0.5 levels, which mean weekly movement is as high as 6
month forward premium.
With
steady decline in forward premium and recent surge in volatility, it is safer
to argue that now forward premiums should have little say in USDINR forward hedging
strategies. The decision of hedging currency risk should not be affected by it
residual maturity.